Product
wellVizion is capable of a wide range of visualization options for drilling, geological, well operations, and well servicing data management.
- All
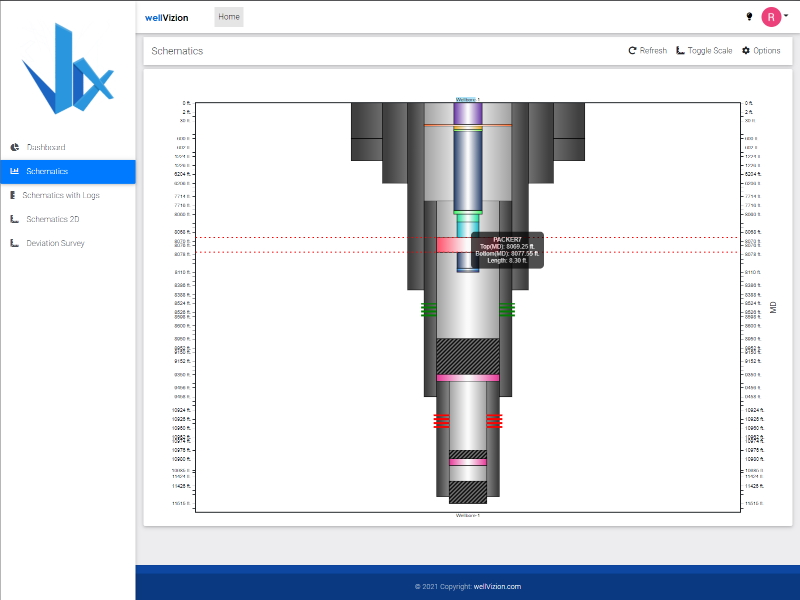
- Well Schematics
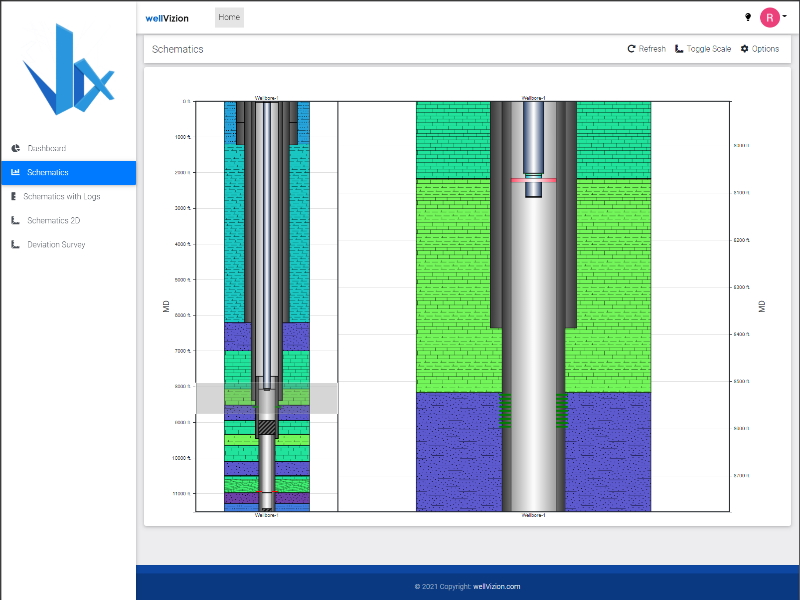
- Lithology
- Well Logs
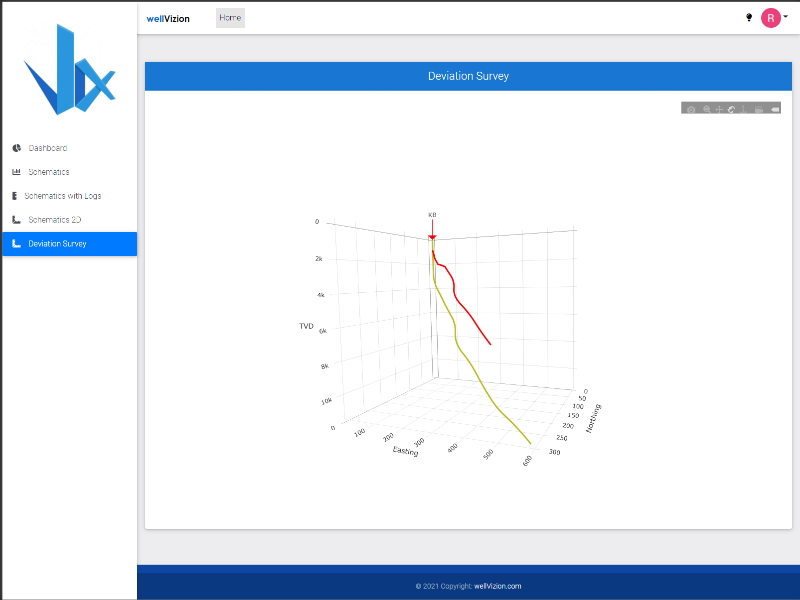
- Deviation Survey

Select Well
Intial page for well selection.

Well Schematics Diagram
Wellschematics diagram with Lithology and Data table

Customization Options
Well Schematics Diagram Setting panel for diagram customization options.

Edit Well Components
Edit the dimentions of the components from the diagram.

Well Logs
Side-by-side Well Log Visualization

Well Component Detais
Tooltip to display well component details with depth scale reference.

Lithology Detais
Tooltip to display lithology details with depth scale reference.

Zooming
Zoom in to specific depth levels for detailes analysis.

Deviation Survey (3D)
Visualize well path in an interactive 3D diagram.
"We are constantly improving our software by listening to our customer demands."
Make the most of your Drilling & Completions data with wellVizion
Enable everyone at every level of your organization to make confident decisions using latest data-driven Well Schematics diagrams.
Features
- All Features
- Solution Features
- Technology Features
Connection to Multiple Data Sources
wellVizion has the power to integrate with different E&P databases and capable to import data from a wide variety of known data models. It is pre-configured to recognize connection to industry-established and standardized databases such as EDM, Seabed and PPDM, it has the capability to read data from custom databases as well. Thus allowing users to easily correlate different data types from multiple sources and extract valuable information out of the anthology.
Highly flexible User Interface
wellVizion provide unlimited flexibility to visualize casing and liner records, completion records, ICD records, perforation records, wellheads in well schematic view and tabular view. Separate panels for well schematic diagram, and data tables, logs, formation tops and lithology.
Deviation profiles, multi-borehole profiles
Visualization of a well’s deviation profile, sidetracks and multi-laterals based on the deviation survey records. The uncertainty of well’s position can also be plotted if all required parameters for calculation of wellbore’s error model exist.
Well Logs
Plots all types of logs from digital logs database. These can include open hole logs such as resistivity, neutron-density, gamma ray logs around zones of interest, and cased hole logs such as CBL and VDL for cement quality assessment around casings.
Formation Tops and Lithology
The solution provides layouts of formation tops and lithology correlated with MD and TVD. These plots can be shown in the wellbore’s backgrounds or can be plotted in separate adjacent panels.
Well Lifecycle Visualization
The solution provides facility to view the progressive stages of a well if the relevant data for each stage is available. For example, it is possible to view and analyze the changes in a well’s completion status after each rig or rigless event against changes in production figues after each such event.
Integration into client’s Existing IT Infrastructure
wellVizion has a distributed architecture that can be easily deployed within client existing IT infrastructure. This makes it a completely flexible solution that can maintained with a lean in-house team or a highly flexible remote team.
Corporate well data monitoring workflows and tools
Templates for viewing the well profile along with all other relevant data. Corporate template enforced across the organization and to service providers, team template and personal use template.
No high-end server required
wellVizion deployment does not demand any high-end servers. It can be installed on existing server spaces with low-end specs, thus minimizing soultion implementation costs.
No licensing required
The solution does not need user specific licensing, and can be an easily accessible solution that is freely available to all potential users having adequate access rights.
Zoom in and Zoom out on Well Sections
The solution makes it possible to bring, collate and correlate different data types collected during different stages of the well on to one intuitive platform. This makes the jobs of different stakeholders of the well very easy. Geologists can analyze and identify well construction related challenges, reservoir engineers can correlate well logs and well profile with sand zones and production data, completion and artificial lift engineers can visualize and correlate completion jewelry with deviation profile and formations.
wellVizion
- Developed exclusively for your business
- Tailored solution provides flexibility to integrate into your existing Ecosystem with minimal footprint
- Works with minimal data types requirements
- Works sturdily even with low data quality, with the help of business rules created during deployment
- Easily modifiable and expandable
- No user access license restrictions once deployed in client environment
- Offer competitive advantages over competitors
Other Solutions
- Rigid off-the-shelf solution may not meet all your business's requirements
- Limitation in flexibility to integrate and might have compatibility issues
- Requires a large range of data types that are normally not recorded in company’s database
- Breaks down easily if strict data quality and availability is not assured
- Mostly rigid and difficult to modify and integrate
- Number of users are restricted by the number of concurrent user licenses bought
- Using same solution as other competitors
Uniqueness of the service
We have the expertise to develop and deliver cutting-edge technology so that you can achieve your business objectives.
Customized according to the client needs
Customized solution will be designed and developed after understanding the exact requirement of the company. After the solution is deployed, the features will not be rigid. They can be customized as and when required just like an in-house solution. Extensive user training. Connection to main databases, even though the database may be a highly-customized non-standard database.
Well integrated company workflows
The workflows associated with well schematic will be developed and adapted according to the needs of the clients, including well data entry workflow, data QC workflow, well creation workflow, rig events creation workflow and rig movement workflow. Other types of workflows associated with well schematic can be incorporated in the solution after getting an understanding of the requirement. For example. A user management system containing a reliable well schematic and quality assurance workflow can be developed so that approvals for well profile designs can be taken from within the Well Schematic solution.
Will work with minimal parameters
wellVizions’s expectations from the data availability standpoint is very low. wellVizions can be customized to draw well schematic using only a few basic mandatory data types such as component name, top depth, bottom depth. Other missing parameters can be assumed by setting business rules for assumption.
Something for every stakeholder team
Stakeholders: Drilling operations teams, field development teams, reservoir management teams, information management teams
On Premise & Cloud Compatible
Capable to delivering highly-customized solution on Windows, Web and/or Mobile plaforms.
Assurance on historical data
As part of the deployment, our deployment team will ensure that all quality-assured historical data will be honored and basic well schematic can be preserved from these historical databases.
Deployment Flexibility
Our Story
We are a small team of professionals with multi-domain experiences in Oil & Gas upstream industry. Our team members’ prime experiences come from developing, deploying and supporting software solutions for oil & gas companies and domain knowledge in drilling, workover operations and production. We often needed to build customized solutions to solve complex business problems: gather data from commercial-off-the-shelf (COTS) enterprise applications, make sense of it by applying custom business rules, and share the results as printable reports or though dashboards.

Automated Well Schematics diagram generation was one among our major projects.
On the surface it might seem straightforward, but after the collecting, analyzing, processing, and other work were done, we are still left with important questions to answer:
- How do we share what we’ve learned with others in a meaningful way?
- How do we enable others to visualize their own drilling and completion data with minimal effort?
- Can we deliver a simple solution to automate Well Schematics diagram generation?
- Can we utilise the advancement in technology to minimise the footprint in deployment and integration?
As professionals from oil & gas industry we have tried to address these questions. During this journey, a more fundamental concern has surfaced and taken shape: how can businesses make meaningful use of their data, if its use and understanding are restricted to just a few technologies and platforms?
While we sought the answers to these important questions to give a complete and seamless experience we unearthed a wealth of knowledge about the challenges, requirements and expectations of our target users: the asset teams from exploration, field development and reservoir studies, operation teams from drilling, artificial lift, production and well surveillance and support teams like data management and IT support.
This was the seed that started wellVizion.
Armed with this wealth of understanding we have focused our attention to:
- cover an entire range of functionalities regarding well diagram reporting
- build a sturdy solution that works with minimal data
- provide the best of UI experience with contextual information from other sources
- ensure seamless integration with operational workflows
- design with company’s data/application integration in mind
- guarantee solution scalability
Contact
Our Address
Spring Mountain, Brisbane, QLD, Australia - 4300
Email Us
contact@wellvizion.com
